Ineffective Visual Display

Gun violence


This is an ineffective visual display because the graph is very cluttered and isn’t labeled clearly for the viewer.It seems that the maker of the graph only wanted the viewers to see the United States on this graph because that’s the only part of it that I noticed. I didn’t pay attention or even care about the other countries and numbers. The redline seems to be the best fit line but it isn’t labeled so the viewer won’t know that.

Ineffective Visual

Screen Shot 2012-12-21 at 5.56.57 PMThis is an example of an ineffective visual because it is extremely cluttered and confusing. It is not clear where you should begin and there is just a great deal going on. There are just circles leading to more circles and it’s hard to follow what is connected to what.

Effective Visual

Screen Shot 2012-12-21 at 5.56.45 PMThis is an effective visual because it clearly depicts the complete workout and includes a detailed explanation and diagram. The visual is well organized and easy to follow. There are no distracting features that would confuse the viewer, so overall it achieves its purpose.

Interview: Dr. Jimmie Fata

1. How would you describe your research?

The research within my lab is made of two components. There is the cancer component where we try to understand cervical cancer and breast cancer. Then there is the regular biology component where we try to explore and understand the biology basis of the tissue of these cells.

2. How did you become interested in this area?

As a Ph.D. student I studied breast biology and breast cancer and I just never stopped. At the time I desperately wanted to start working in a lab and someone offered me a volunteer position in a lab. In that particular lab they worked on breast biology and breast cancer and since then I just continued.

3. How long have you been in this field?

Since 1998 so about 14 years now.

4. What other fields did you consider before entering this area?

At first I thought about maybe doing drug discovery or heart research. But then I decided to focus primarily on breast cancer. I have been able to incorporate drug discovery into my breast cancer research. Within the lab we do some drug discovery, we try to find new drugs from all over. So I’m able to have a little bit of the best of both worlds.

5. What degrees do you have?

I have a BS from the University of Guelph in Canada and I have a Ph.D. from the University of Toronto.

6. How do you balance your research with other responsibilities?

As a professor there are three essential responsibilities; conducting research, teaching, and then community service. So it’s a matter of keeping all three of these things balanced. You just have to manage your time well and keep your priorities in check.

7. Would you recommend your field to someone aspiring to do research?

I would, if you have passion for whatever you’re doing you’ll always succeed. It’s tough, there are long hours and little recognition. But if it’s something you love and are willing to put in the time and effort, you should of course get involved.

8. What is your next step in your research?

The next step is to now translate what we have discovered in the lab into the clinical world. We have been collaborating with the Staten Island University Hospital and doctors have been coming to the lab and we’re trying to take our lab work and apply it into clinics.

Interview: Professor James Riddle

How would you describe your research?

I study the civic culture of late Medieval York, a city in Northern England.

How did you become interested in this area?

It started in grad school when I saw plays on the city. These plays got me interested in the way the plays were connected in the culture of the city. Then as I studied more the background became more of the foreground.

How long have you been in this field?

I started working on it half way through grad school, so about 10 years.

What other fields did you consider before entering this area? 

Dissertation on a poem called Piers Plowman from 14th century England.

What degrees do you have?

MA and PHD in English from the University of Wisconsin Madison

How do you balance your research with other responsibilities?

One instance, the classes I teach that have a focus on urban culture, I try to incorporate my research with these classes.

Would you recommend your field to someone aspiring to do research?

Culture in transition is fascinating, specifically late mideval culture is really interesting in the time that we’re in now of information revolution. Later mideval age information revolution shifted from focus on the speaking voice to focus on written word.

What is your next step in your research?

Currently working on a manuscript called Making do the City Writing Performance and Government. I’ve also been interested in looking at psychrelioguse plays. Looking at the Passion plays focus on the violence may correlate with the violence seen in the city.

Ineffective Visual

Ineffective Visual

This is an example of an ineffective visual display. There are several reasons as to why this can be viewed as a bad graph. For instance, the ratio between data and ink usage is not within reasonable proportions. All of the text within the visual is a bit overwhelming to the viewer, and can be confusing. The distinctions between each colored section of the pie chart is hard to distinguish and the text defining each part is difficult to follow. I believe that Tufte would consider this visual to be completely ineffective. The usage of a pie chart for this content may not have been the best idea, and perhaps the use of another kind of visual display should have been utilized.

Effective Visual

Effective Visual

This is an example of an effective visual display. All of the space within the graph is being utilized to its full potential, and there is barely any chart junk within it. The axises are clearly labelled, as are the line graphs. It’s a clear visual that the viewer wouldn’t be confused by, and the information that is being translated can be easily understood. I believe Tufte would consider this an effective visual because of the lack of chart junk, as well as there being no amount of unnecessary decoration or effects put on the graph to distract the viewer and make the content less understandable.

Interview with a Scientist: Nldhi Khanna Graduate Student

Nldhi Khanna is a graduate student at the College of Staten Island. She is currently conducting research in Dr. Fata’s Lab.

1) How would you describe your research?

I work with breast cancer cells and different types of chemotherapy drugs. I also work on keeping several cell lines running and exposing them to different types of drugs.

2) How did you become interested in this area of research?

I heard great things about Dr. Fata’s lab, many of my friends took his classes and worked with him, and I had previous experience with cell culturing as an undergraduate student. I thought it would be very interesting and worthwhile to work in his lab, and so far it’s been a great experience!

3) How long have you been working in this field?

I’ve done cell culturing since I was an undergraduate student, and I started working with Dr. Fata this past summer.

4) What other fields of work did you consider before entering this area?

I considered working with electron microscopes, but I really do enjoy working with different cells. I also perform work with the advanced imaging facility at CSI as well, so for me it’s the best of both worlds.

5) What degrees do you have?

I have a BA in Biology and I’m currently working towards my Master’s degree now.

6) How do you balance research with other responsibilities?

It’s really all about balancing time, and you can’t really set a time table because cells grow unpredictably. I just try my best use my time wisely and attempt to set a schedule as best I can for each week.

7) Would you recommend your field to someone aspiring to do research?

Yes I would! I think anyone interested in any field of science should get involved in a lab; it’s one thing to just learn from a textbook and during lectures, but actually seeing how things work is quite incredible. Also the research I’m preforming might actually help people one day, which is a great thought.

8) What is the next step in your research?

I plan to finish my thesis, hopefully this May, and then I’ll just go from there. I do plan on continuing to perform research in the future as well.

Effective Visual

birth-rates-1920

I thought that this was an effective visual because it clearly shows what it intended to show. There is nothing fancy or decorative, it just simply shows the birth rates from 1920-2010. It gives you just enough information to understand the graphic very quickly. The only thing I think Tufte would not like about this graphic is the dotted background. However, I actually like that it is there because it gives me a way to clearly match the sections of the line graph with actual numbers.

Ineffective Visual

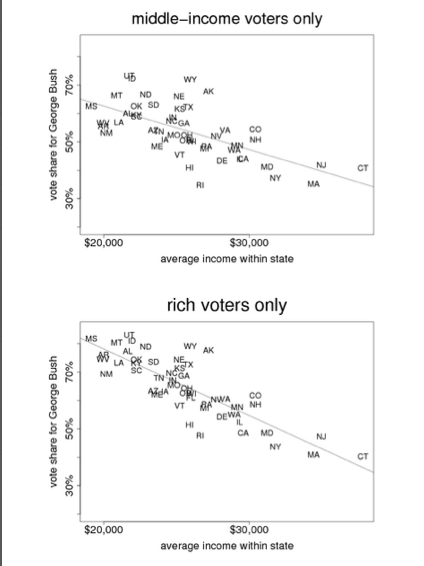
Screen Shot 2012-12-02 at 9.41.07 PM

I thought that this graph was a very good example of a ineffective visual. This graphic is way too difficult to comprehend. I think that Tufte would agree that this graph contains way too much chartjunk. Having all the states labeled by initial is very confusing and unnecessary. It makes the graph impossible to read because some of the states overlap and become illegible. All of the chartjunk makes it extremely difficult to even comprehend what the point of the graph is.