Roosevelt Avenue: Contested Terrain, Neighborhood Center, or Border?
Currently viewing the category:
"Residential Population: Whose Home?"
The focus of our demographic study is on Roosevelt Avenue. Roosevelt Avenue runs through the neighborhood of Corona (including North Corona) and serves as a border between the neighborhoods of Jackson Heights and Elmhurst. Thus, the demographics of three neighborhoods, Corona, Jackson Heights, and Elmhurst were examined during the process of data collection for areas, city blocks, surrounding Roosevelt Avenue. This was done so via census tracks surrounding the avenue of interest. The exact census tracts are highlighted below.

Map depicting the neighborhoods surrounding Roosevelt Avenue. The census tracts within the yellow border was used to obtain demographic and economic data in the surrounding area of Roosevelt Avenue. (based on census map by the New York City Government)
sources:
Census Data Along Roosevelt Avenue in Jackson Heights
Since our focus is on Roosevelt Avenue, a study of observable patterns in the census tracts along Roosevelt Avenue (and within Jackson Heights) tells us about the racial composition of the population. Moreover, these census tracts also give us a breakdown of the median income level by race, the percentage of the population under the poverty line and the specific ethnicities that are represented along Roosevelt Avenue. Let’s look at some of these patterns and their significance:

This data is based on the American Community Survey 5 year estimates via socialexplorer.com (Years 2007 to 2011)
Along Roosevelt Avenue, there is a relatively high population of Hispanics and Asians. This information is arranged according to the various census tracts along Roosevelt Avenue. As we have seen and discussed in class before, highly concentrated areas such as “Little India” and “Little Colombia” contribute to the racial diversity of Jackson Heights.

This data is based on the American Community Survey 5 year estimates via socialexplorer.com (Years 2007 to 2011)
We are already aware that Jackson Heights is a hyper-diverse community. This graph provides further evidence that within the “Hispanic” race, there is extreme ethnic diversity as well. We can see that Colombians, Ecuadorians and Mexicans are the dominant ethnic groups along Roosevelt Avenue. Although Dominicans are represented in fewer numbers than the three dominant ethnic groups, it is interesting that Dominicans are present in the highest concentration in the area covered by census tract 273.
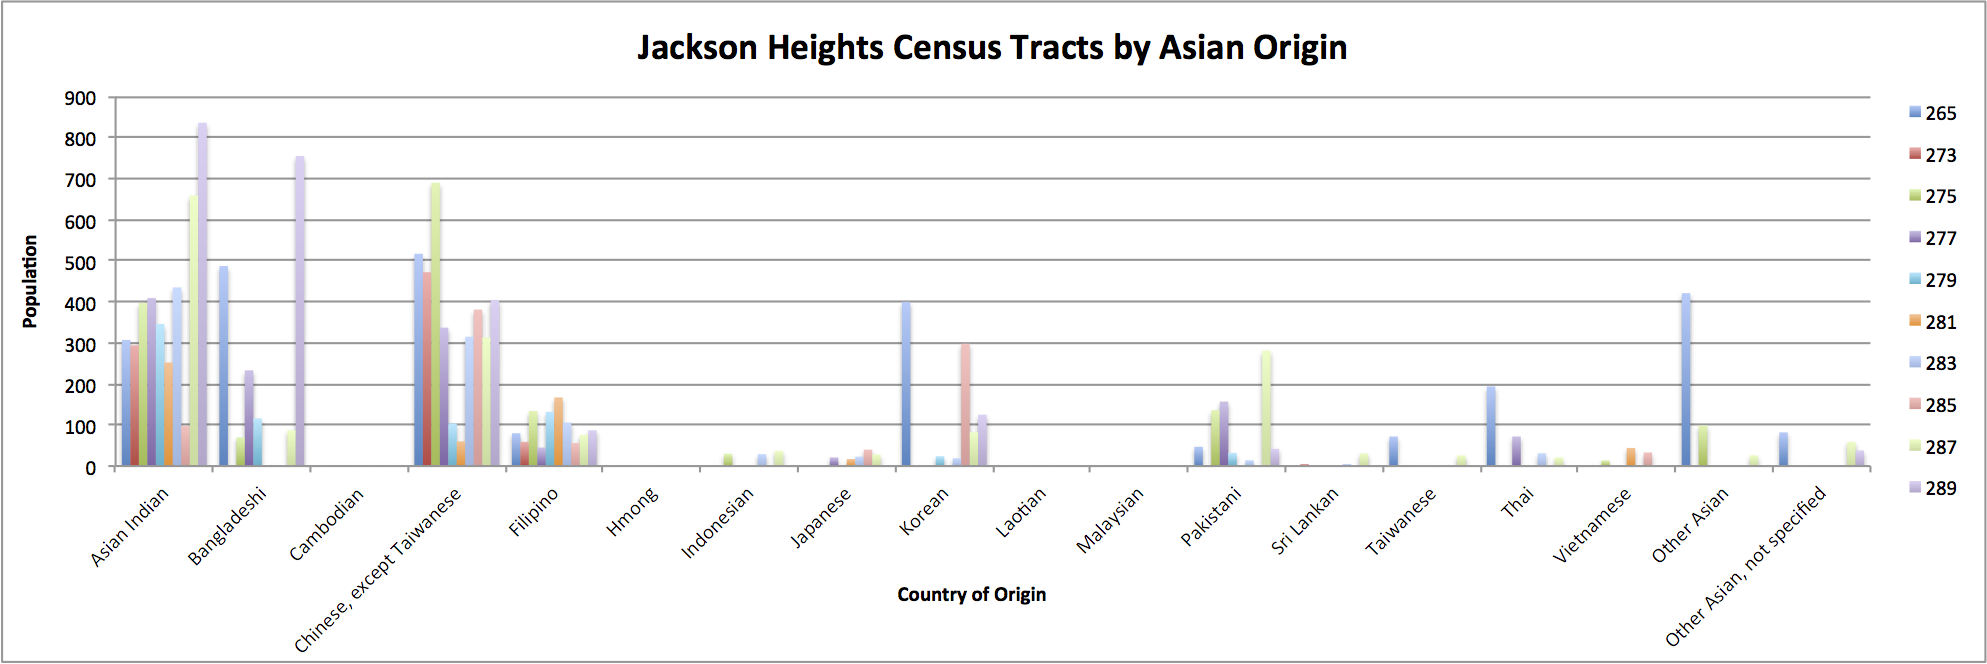
This data is based on the American Community Survey 5 year estimates via socialexplorer.com (Years 2007 to 2011)
Similar to the previous graph, this graph shows us ethnic diversity within the “Asian” race. It is clear that Asian Indians and Chinese (except Taiwanese) are the dominant ethnicities along Roosevelt Avenue. Also, once again we see that ethnicities such as Japanese and Korean are highly represented within one specific census tract but then in other census tracts, they are highly underrepresented.
While the focus of this project is on Jackson Heights and Corona, census data from the Elmhurst must be considered as well because Roosevelt Avenue serves as the border between Elmhurst and Jackson Heights. Therefore, both neighborhoods must be observed in order to create an accurate depiction of the demographic and economic situation along Roosevelt Avenue. The data below consists only the demographic situation of the census tracts in Elmhurst surrounding Roosevelt Avenue.

Racial demographics of the census tracts in Elmhurst that border or cover Roosevelt Avenue between the years 2007 and 2011 (based on the American Community Survey 5-year via socialexplorer.com).
Like the demographics along Roosevelt Avenue in Jackson Heights and Corona, the area is predominantly Hispanic/Latino and Asian. Already the most prevalent of the races in Elmhurst, Asians and Hispanics/Latinos still continuously choose to settle in Elmhurst causing a steady increase in Asian and Hispanic/Latino population. It should be noted that the Hispanic/Latino and Asian population can be and should be further distinguished by country of origin for two reasons. One, many of these immigrants are highly transnational and have a strong sense of affiliation with their home nation and, two, there is substantial differences amongst people of different nationalities in terms of culture and values.

Hispanic/Latino population by country of origin between 2007 and 2011 (based on the ACS 5-year estimate via socialexplorer.com)
Based on the data above, the Hispanic/Latino population in Elmhurst surrounding Roosevelt Avenue is predominantly Mexican, Dominican Republic, Columbian, and Ecuadorian with substantial increases in population from each of these four country of origin. The most prevalent country of origin is Ecuador as of 2011.

Asian population by country of origin between 2007 and 2011 (based on the ACS 5-year estimate via socialexplorer.com)
Here, we see the most prevalent countries of origins among Asians in Elmhurst, Roosevelt Avenue to be China, the Philippines, India, Bangladesh, and Korea. As of 2011, the Chinese and Filippino population are the most prevalent within these five nationalities.
Sources:
socialexplorer.com
With the aim of our project being to study Roosevelt Avenue, a closer look at the census tracts bordering Roosevelt Avenue in Corona gives a us a better visual of the demographics of this area. The data from these census tracts permits us to see the origins of the residents of these areas, as well as their economic standing. Furthermore, data from these census tracts allows us to see emerging economic and racial patterns in Corona, Roosevelt Avenue.

Racial demographics of the census tracts in Corona that border or cover Roosevelt Avenue between the years 2007 and 2011 (based on the American Community Survey 5-year via social explorer.com)
Looking at the chart above, it is evident that most of the people living in the Corona census tracts near Roosevelt Avenue are of Hispanic/Latino and Asian descent. This same trend is seen in Jackson Heights and Elmhurst as well. However, it is interesting to note that Corona has the smallest Asian population in comparison to these neighborhoods, with the Hispanic population greatly dominating this area. Besides Asians, it can be seen that individuals that are White, African American or Other are also greatly underrepresented in these census tracts.

Hispanic/Latino population by country of origin between 2007 and 2011 (based on the ACS 5-year estimate via socialexplorer.com)
Based on the census tract data for Corona shown above, one can see that most of the Hispanic/Latino residents of Corona, Roosevelt Avenue are of Ecuadorian, Dominican Republic and Mexican origin. In sharp contrast to this, there is an extremely low number of residents of other Hispanic/Latino origin.

Asian population by country of origin between 2007 and 2011 (based on the ACS 5-year estimate via social explorer.com)
Here it can be noted that most of the Asian residents living in the Corona census tracts shown above are of Asian Indian and Chinese (except Taiwanese) origin. The Asians of Chinese (except Taiwanese) origin make up the majority of Asian residents living in these census tracts as of 2011. On the other hand, Asians of other origins are barely present in these census tracts.
The median household income and poverty levels of the areas surrounding Roosevelt Avenue is compared with that of the entire New York City.

Median household income by race of the areas surrounding Roosevelt Avenue organized by neighborhood and compared to the entire New York City. (based on 2007-2011 ACS 5-year estimates via socialexplorer.com)
Here, we see that the median income levels of Asians in all three neighborhoods are actually below the New York City levels. We see an opposite effect for the Hispanic population where the Hispanics living in Jackson Heights, Corona and Elmhurst have higher income levels than all of New York City.

Poverty Levels by Race of the areas surrounding Roosevelt Avenue organized by neighborhood and compared to the entire New York City. (based on 2007-2011 ACS 5-year estimates via socialexplorer.com)
This graph shows the percentage of a specific race that is under the poverty level in 2010. One very interesting thing to note is that although 23.2% (Elmhurst) and 32.1% (Corona) of the Asian population is under the poverty line, only 18.3% of all New York City Asians are under the poverty line. The opposite effect is seen within the Hispanic population where the percentage of the Hispanic population of Jackson Heights, Corona and Elmhurst below the poverty line is actually lower than the percentage of Hispanic population under the poverty line in all of New York City.
