From The Peopling of New York City
Current Demographics
From the 2000 Census[1]
By Gender
|
| Population
| Percentage
|
| Total Population
| 69,840
| 100%
|
| Male
| 33,435
| 47.9%
|
| Female
| 36,405
| 52.1%
|
By Age
| Age
| Population
| Percentage
|
| Under 5 years
| 3,944
| 5.6%
|
| 5-9 years
| 3,719
| 5.3%
|
| 10-14 years
| 3,273
| 4.7%
|
| 15-19 years
| 3,136
| 4.5%
|
| 20-24 years
| 3,956
| 5.7%
|
| 25-34 years
| 13,000
| 18.6%
|
| 35-44
| 11,669
| 16.7%
|
| 45-54 years
| 9,432
| 13.5%
|
| 55-59
| 3,439
| 4.9%
|
| 60-64
| 2,979
| 4.3%
|
| 65-74
| 5,568
| 8%
|
| 75-84
| 4,061
| 5.8%
|
| 85+
| 1,664
| 2.4
|
By Race
| Race
| Population
| Percentage
|
| One Race
| 65,886
| 94.3%
|
| White
| 54,606
| 78.2%
|
| Black
| 1,150
| 1.6%
|
| American Indian/Alaska Native
| 169
| 0.2%
|
| Asian
| 7,024
| 10.1
|
| Asian Indian
| 833
| 1.2%
|
| Chinese
| 3,784
| 5.4
|
| Filipino
| 430
| 0.6%
|
| Japanese
| 85
| 0.1%
|
| Korean
| 874
| 1.3
|
| Vietnamese
| 86
| 0.1%
|
| Other Asian
| 932
| 1.3%
|
| Native Hawaiian & Pacific Islander
| 38
| 0.1%
|
| Native Hawaiin
| 13
| 0%
|
| Guamanian or Chamorro
| 2
| 0%
|
| Samoan
| 10
| 0%
|
| Other Pacific Islander
| 13
| 0%
|
| Other race
| 2,899
| 4.2%
|
| Two or More Races
| 3,954
| 5.7%
|
Currently, the population of Bay Ridge, Brooklyn is fairly diverse. Although the gender population is about even, with 4.2% more females than males, and the age of the population follows a fairly standard bell curve with most of the population falling between the ages of 25-54, when looking at race, Bay Ridge is a very diverse neighborhood. Although 78.2% of the 2000 Census declare themselves "white," Bay Ridge also boasts Native American Indians and Alaskans, Japanese, Filipinos, and Koreans, with a small number of people from the American Samoa and Guam.
Interestingly, Bay Ridge has a very small African American population compared to the rest of Brooklyn, as only 1.6% of people declared their race as "black" on the 2000 Census. Bay Ridge also holds a much higher Asian population, where 10.1% claim their race as "Asian," with an additional 5.4% who also declare themselves Chinese.
Historic Demographics
From the Census's of 1840-1880[2]
Demographics from 1840-1880
| Year
| Population
| Race
| Percentage
|
| 1840
| 36,233
| Total Population
| 100%
|
|
| 34,458
| White
| 95.1%
|
|
| 1,775
| Freed Black
| 4.9%
|
|
| 3
| Black Slave
| <1%
|
| 1850
| 96,838
| Total Population
| 100%
|
|
| 94,414
| White
| 97.5%
|
|
| 2,424
| Black
| 2.5%
|
| 1860
| 266,661
| Total Population
| 100%
|
|
| 262,348
| White
| 98.4%
|
|
| 4,313
| Black
| 1.6%
|
| 1870
| 396,099
| Total Population
| 100%
|
|
| 391,142
| White
| 98.7%
|
|
| 4,944
| Black
| 1.2%
|
| 1880
| 566,663
| Total Population
| 100%
|
|
| 558,427
| White
| 98.5%
|
|
| 8,095
| Black
| 1.4%
|
Unlike Bay Ridge today, between 1840 and 1880, Bay Ridge was very homogeneous, dominated by whites, most of whom were Dutch farmers. In fact, between 1840 and 1880, the population of whites was steadily increasing, only falling by 0.2% in 1880. By 1870, 98.7% of the population was white, while only 1.2% were considered black or African American.
Aside from Bay Ridge's lack of racial diversity in the early years of its existence, it is very significant to note the population growth between 1840 and 1880. In 1840, when Bay Ridge was still called "Yellow Hook," there were only 36,233 living in Brooklyn as a whole—a huge contrast to today's 69,840 in Bay Ridge and the 2,465,326[3]
in Brooklyn as a whole. That's an increase of over 2,429,000 people! Even just to look at the time span of 40 years we see a huge increase, from 36,233 in 1840 to 566,663 in 1880, increasing by 530,430 people or nearly 1,600%! This was mostly due to improved transportation to the area, as we can see from the History of Bay Ridge page.
Cultural Diversity in Bay Ridge
A look at the diversity existing in Bay Ridge and Rural Kings County as a whole during the 1860s-1880s[4]
Ethnicity Among Farm Laborers: 1860
| Ethnicity
| Number
| Percentage
|
| Irish
| 460
| 63%
|
| US Black
| 93
| 12%
|
| German
| 89
| 11%
|
| US White
| 79
| 10%
|
| English
| 18
| 2%
|
| Scots
| 5
| 1%
|
| French
| 2
| <1%
|
| Swiss
| 1
| <1%
|
| Danish
| 1
| <1%
|
|
| Total Pop
| 788
|
Ethnicity Among Farm Laborers: 1870
| Ethnicity
| Number
| Percentage
|
| Irish
| 249
| 38%
|
| US White
| 143
| 22%
|
| German
| 143
| 22%
|
| US Black
| 89
| 14%
|
| English
| 9
| <1%
|
| Swiss
| 3
| <1%
|
| French
| 3
| <1%
|
| Swedish
| 2
| <1%
|
| Dutch
| 2
| <1%
|
| Norwegian
| 2
| <1%
|
| Scots
| 1
| <1%
|
| Welsh
| 1
| <1%
|
| Danish
| 1
| <1%
|
|
| Total Pop
| 648
|
Ethnicity Among Farm Laborers: 1880
| Ethnicity
| Number
| Percentage
|
| US White
| 213
| 35%
|
| Irish
| 162
| 27%
|
| German
| 97
| 16%
|
| US Black
| 74
| 12%
|
| 2nd Gen. Irish
| 35
| 6%
|
| Swiss
| 7
| 1%
|
| English
| 7
| 1%
|
| Polish
| 5
| 1%
|
| Scots
| 3
| <1%
|
| Austrian
| 3
| <1%
|
| Swedish
| 3
| <1%
|
| French
| 1
| <1%
|
| Dutch
| 1
| <1%
|
|
| Total Pop
| 611
|
Although the number of farm laborers shrank, the diversity definitely increased over the 20-year time span. Immigration from the Netherlands, such as Norway and Sweden, began to increase, and by 1880, Europeans, such as the Polish, Austrians, and Swiss began to arrive. Most of this immigration was due to the huge migration that was going on throughout the entire United States, especially into Manhattan, and, like most new immigrants, these people took the jobs of unskilled laborers, such as farm laborers. Unlike earlier, however, with the increased transportation of steam trains and ferries that went into Bay Ridge and Brooklyn starting in the 1860s, these diverse groups were moving into Bay Ridge. It is also helpful to look at these statistics compared with the corresponding census information. Unlike today, between the 1860s and 1880s, there were only two races on the census: black and white. So even though, according to the 1860-1880 census information, we see a huge increase in "white" population, we are really seeing Bay Ridge and Brooklyn growing more diverse, not less.
Projected Population Growth: 1910-1950
Population Estimates, Source: NY Times Feb 23, 1908
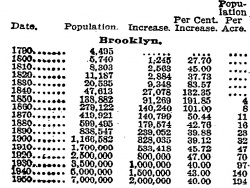
In February of 1908, in an article addressing the need to increase the number of subways going through Manhattan to its outskirts of Brooklyn, Queens, the Bronx, and Richmond, the New York Times provided support for this through a chart of estimated population increase in each area. Although they are just estimates, it is interesting to see, based on this article, the possible expansion Brooklyn would be expected to undergo over the course of the next 40 years. For an interesting comparison to the table on the right, here are the numbers of actual population growth, courtesy of the US Census Bureau, for Brooklyn, NY, between 1910 and 1950, along with the NY Time's estimates.
Actual vs Estimated Population, 1910-1950
| Year
| Actual Population
| Estimated Population
|
| 1910
| 1,634,351
| 1,700,000
|
| 1920
| 2,018,356
| 2,500,000
|
| 1930
| 2,560,401
| 3,500,000
|
| 1940
| 2,698,285
| 5,000,000
|
| 1950
| 2,738,175
| 7,000,000
|
From what we can see, the estimates are completely off, estimating an average increase of 1,325,000 people a year, to Brooklyn alone. Although the city turned out very different, mostly based on unexpected factors such as the birth of the suburb as the car expanded to a larger market, it is interesting to see how the people of the time viewed themselves and the world around them, and would help explain the sudden increase in public transportation. As seen in History of Bay Ridge, the R Train was opened in Bay Ridge in 1916, with the first digging beginning in 1912—just a few years after this article was published. Other subway lines were also expanding at this time. For example, the West Side IRT (the "red line"), expansions were made into 34th street in 1917, South Ferry in 1918, and into Brooklyn in 1919. Other subways rapidly followed suit in what can be read as a direct correlation to the information in this article—a rapidly expanded city that needed a way to transport all its citizens using as little above-ground space as possible.
- ↑ These demographics are based on the current census tracks for Bay Ridge
- ↑ This Census information is based on the only available data and represent Brooklyn, not just the Bay Ridge area.
- ↑ Census Bureau information for Brooklyn, NY as a whole, based on the 2000 Census
- ↑ Like the historic demographics, these statistics are not for only Bay Ridge. Instead, they are for "Rural Kings County." Source: Of Cabbages and Kings County by Marc Linder and Lawrence S. Zacharias
To the Bay Ridge homepage.
Made by Christina Squitieri, Victor V. Gurbo, and Neyra Azimov