Neighborhoods and Communities
|
Coney Island Context
From The Peopling of New York City
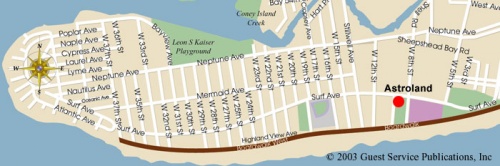
Where is Coney Island?
Coney Island is a part of the peninsula jetting out at the south-western tip of Brooklyn. The surrounding neighborhoods include Sea Gate (West), Brighton Beach and Manhattan Beach (East), and Gravesend (North). Before Coney Island was considered a great amusement area, it was just a piece of uninhabitable land that no one really deemed a good living space. As Futrell quotes from the 1866 New York Times: "It lies low, is flat and unpicturesque, dreadfully sandy, and next to Jersey, and breeds the most ferocious mosquitoes."[1] Originally, Coney Island was an actual island that was separated from the mainland by way of the Coney Island Creek. However, when developers wanted to begin building on the site, they started "filling in Coney Island Creek—a process that unfolded over several decades."[2]
In the beginning of the 20th century, Coney Island was at the height of its popularity. Swarms of people came from all over to spend their time in the amusement parks. But when the Second World War broke out, the popularity of the park declined over time due to increased fear. After the war ended, the Cold War came in and continued to rattle the residents. They were in fear and that destruction was imminent and some residents went so far as to pick up and leave Coney Island in search of safer homes. After many years of neglect and in the face of a booming population, city planners decided to focus their attentions on developing public housing instead of recreational amusement areas. They wanted an "urban renewal."[3] After the buildings rose one after another, the face of Coney Island became a home for many lower class families instead of the majestic summer resort it once was.
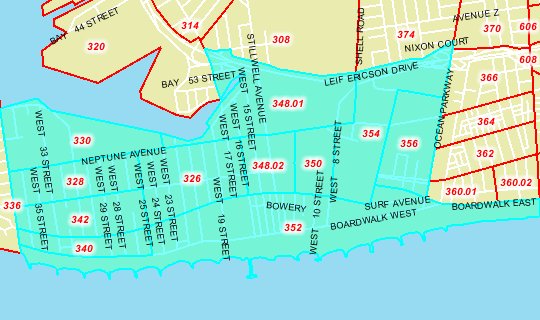
These 11 different Census Tracts are going to be the area we dub as "Coney Island." Because there is dispute among different demographers as to where one neighborhood ends and another begins, our executive decision (with the help of a City Planning official), will be to use these particular tracts when giving our demographic information on the area. Tracts 354 and 356 were once part of an area known as West Brighton, which does not exist anymore by today's geography standards. It is being included in our census data interpretations because it was here that some of the past amusement parks were located, thus making it a part of historic Coney Island.
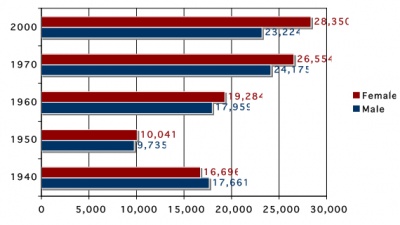
Sex Comparison
|
| 1940
| 1950
| 1960
| 1970
| 2000
|
| Male
| 17,661 (51.4%)
| 9,735 (49.2%)
| 17,959 (48.2%)
| 24,175 (47.7%)
| 23,224 (45.0%)
|
| Women
| 16,696 (48.6%)
| 10,041 (50.8%)
| 19,284 (51.8%)
| 26,554 (52.3%)
| 28,350 (55.0%)
|
| Total Population
| 34,357
| 19,776
| 37,243
| 50,729
| 51,574
|
Though slightly more men resided in Coney Island during the 1940s, the population of men and women was relatively balanced. The numbers shifted during the 1950s through the 1970s. Perhaps this was due to the growth of more housing in the area that allowed more affordable, middle-class housing units.
However, as can be seen, the percentage of men living in the area lessened as compared to the percentage of women. The male population only grew by approximately 7,000, whereas the female population grew by approximately 10,000. The percentages shifted over a 30 year span.
Employment
|
|
| 1940
| 1950
| 1960
| 1970
| 2000
|
| Employment:
|
| Population Age 14+ (1940-1970) / 16+ for 2000
| 32,922 (79.3%)
| 28,964 (80.2%)
| 29,217 (73.5%)
| 38,115 (75.1%)
| 40,376 (78.3%)
|
| In Labor Force
| 16,622 (50.5%)
| 14,431 (49.8%)
| 13,189 (45.1%)
| 18,009 (47.2%)
| 16,772 (41.5%)
|
| Employed
| 12,692 (76.4%)
| 12,863 (89.4%)
| 12,168 (41.6%)
| 17,115 (44.9%)
| 14,558 (86.8%)
|
| Unemployed
| 3,125 (18.8%)
| 1,527 (10.6%)
| 1,021 (3.5%)
| 894 (2.3%)
| 2,170 (12.9%)
|
Male 14+ (1940,1960,1960) /
Male 16+ (1970,2000)
| 16,547 (50.3%)
| 14,239 (49.2%)
| 13,891 (47.5%)
| 17,750 (46.6%)
| 17,282 (42.8%)
|
Female 14+ (1940,1960,1960) /
Female 16+ (1970,2000)
| 16,375 (49.7%)
| 14,725 (50.8%)
| 15,326 (52.5%)
| 20,365 (53.4%)
| 23,094 (57.2%)
|
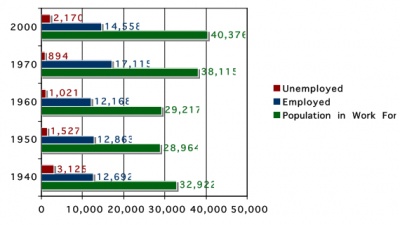
During 1940, the population of people age 14 and above was at 32,922, which was 79.3% of the whole population. However, in 1950, the population dropped to 28,964. This drop was due to the development of public housing in the Coney Island area, along which gang violence increased as well. The people who could afford to move, left the area to escape the consequences of gang violence and crimes. In the labor force from 1940 to 1950, the amount of people working dropped from 16,622 to 14,431 due to the amount of people leaving the Coney Island area. In 1960, the population increased to 29,217, but the labor force continued to drop to 13,189.
It was not until 1970 that the population increased to a much greater number of 38,115. Along with this increase in population, there was an increase in the work force as well to 18,009 people. Over these years, unemployment was affected as well. The amount of unemployment was 3,125 in 1940, but it dropped to 1,527 and less in the 1950’s and the 1960’s. The resurgence of people in the area in the 1970’s caused the unemployment to decrease to 894. In the year 2000, the population of people age sixteen and above was up to 40,376. Despite that, the employment rate dropped due to the increase of people competing for jobs.
Housing Comparison
|
|
| 1940
| 1950
| 1960
| 1970
| 2000
|
| Occupancy
|
|
| Total Housing Units
| 14,146
| 14,154
| 15,070
| 19,117
| 21,057
|
| Occupied Units
| 11,527 (81.5%)
| 11,265 (79.6%)
| 13,427 (89.1%)
| 18,259 (95.5%)
| 20,327 (96.5%)
|
| Owner Occupied Units
| 1,232 (10.7%)
| 1,690 (15.0%)
| 2,200 (14.6%)
| 7,692 (40.2%)
| 4,304 (21.2%)
|
| Renter Occupied Units
| 10,295 (89.3%)
| 9,575 (85.0%)
| 11,227 (74.5%)
| 9,115 (47.7%)
| 16,023 (78.8%)
|
| Vacant
| 2,619 (18.5%)
| 2,889 (20.4%)
| 1,643 (10.9%)
| 478 (2.5%)
| 730 (3.5%)
|
In the 1940’s and the 1950’s, the amount of housing units did not change much and the occupied housing units were more or less in the range of eleven thousands. During the 1950’s, public housing buildings were being developed and by the 1960’s, they were mostly done. This caused an increase in the amount of housing units in the Coney Island area to 15,070 housing units. With this increase in buildings, more people started to move to these new buildings and the occupied units went up to 13,427. In 1970, the number of occupied units went up to 18,259.
As more people moved into the public housing, less and less became vacant. In 1940, the number of housing units vacant was at 2,619 and in 1970, the number considerably decreased to 478. As the number of housing units increased the number of owner occupied units increased as well, from 1,232 in 1940 to 7,692 in 1970. However, the number of renter occupied units fluctuated up and down in the years between 1940 and 1970. In 2000, the total housing units went up to 21,057 and the amount of occupied units went up to 20,327. There was less owner occupied units because the amount decreased to 4,304. The amount of renter occupied units increase to 16,023 and the amount of housing units vacant went up to 730.
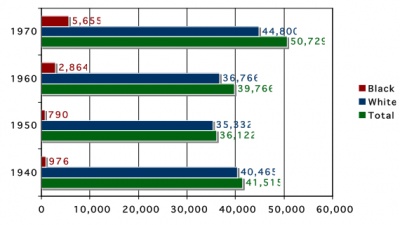
Race Comparison
|
|
| 2000
|
| Non Hispanic
| 42,341
|
| American Indian
| 102 (0.2%)
|
| Asian
| 1,898 (4.5%)
|
| Black
| 13,702 (32.4%)
|
| Hawaiian/Pacific Is.
| 11 (0.0%)
|
| Two Or More Races
| 1,245 (2.9%)
|
| White
| 25,248 (59.6%)
|
| Other
| 135 (0.3%)
|
| Hispanic
| 9,233
|
| American Indian
| 132 (1.4%)
|
| Asian
| 28 (0.3%)
|
| Black
| 1,240 (13.4%)
|
| Hawaiian/Pacific Is.
| 21 (0.2%)
|
| Two Or More Races
| 637 (6.9%)
|
| White
| 3,439 (37.2%)
|
| Other
| 3,736 (40.5%)
|
| Hispanic Status
|
|
| Population
| 51,574
|
| Hispanic
| 9,233 (17.9%)
|
| Non Hispanic
| 42,341 (82.1%)
|
|
|
| 1940
| 1950
| 1960
| 1970
|
| Total Population
| 41,515
| 36,122
| 39,766
| 50,729
|
| White
| 40,465 (97.5%)
| 35,332 (97.8%)
| 36,766 (92.5%)
| 44,800 (88.3%)
|
| Black
| 976 (2.4%)
| 790 (2.2%)
| 2,864 (7.2%)
| 5,655 (11.1%)
|
| Other
| 74 (0.2%)
| 108 (0.3%)
| 136 (0.3%)
| 274 (0.5%)
|
The Black population decreased by .2% during the 1950s. The Black was suppressed and pushed out of Coney Island, especially after war due to racism. As stated during the interview by the Freglette family, they had respect and were not wanted. Frequently in Coney Island, after WWII the Blacks were even beaten and attacked. This was most definitely a major factor in pushing them out.
Poverty Levels (1970-2000)
|
| 1970
| 1980
| 1990
| 2000
|
| Households
| 16,805
| 44,652
| 46,995
| 45,307
|
| Income Below Poverty Level
| 3,979
23.7%
| 11,609
26.0%
| 15,422
32.8%
| 14,889
32.9%
|
| Income Above Poverty Level
| 12,826
76.3%
| 33,043
74.0%
| 31,573
67.2%
| 30,418
67.1%
|
White Households
Below Poverty Level
| 15,034
21.6%
| 4,070
15.8%
| 4,765
20.2%
| N/A
|
White Households
Above Poverty Level
| 11,782
78.4%
| 21,715
84.2%
| 18,852
79.8%
| N/A
|
Black Households
Below Poverty Level
| 694
42.6%
| 5,240
36.4%
| 7,743
44.3%
| N/A
|
Black Households
Above Poverty Level
| 935
57.4%
| 9,160
63.6%
| 9,741
55.7%
| N/A
|
The poverty levels from the 1970s to 2000 show that the gap between the poor and the rich kept continually increased. Those below the income level of poverty continued to lag behind as those above it continued to climb up the ladder. The discrepancy between the numbers of might be due to the fact that as the middle-income families gained wealth, they immediately sought to move out of the declining area. Simultaneously, lower-income families began moving into Coney Island, where affordable housing units were being built. The Census data also shows that the number of impoverished, Black families moving into the area grew ten times between 1970 and 1990.
All the statistics used for tabulating demographical charts are from Social Explorer.
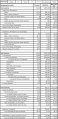
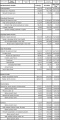
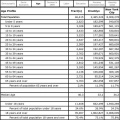
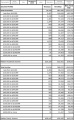
2000 Census Data Charts
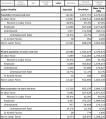
The following data charts were constructed using the 2000 U.S. Census information by the New York City Department of Planning. Their Census FactFinder reference tool has been extremely helpful in the course of this wiki-construction.[4]
|
|
|
|
Housing Characteristics Data
|
|
|
|
References
- ↑ Futrell, Jim. Amusement Parks of New York. Pennsylvania: Stackpole Books, 2006. (pg. 43)
- ↑ Koestler, Marina. "Goodbye My Coney Island?" 1 July 2007. Smithsonian.com. 3 May 2008 <http://www.smithsonianmag.com/people-places/coney.html>.
- ↑ Denson, Charles. Coney Island: Lost and Found. Berkeley: Ten Speed Press, 2002.
- ↑ New York City Department of Planning: http://www.nyc.gov/html/dcp/
|