Views
Contents |
FRESH MEADOWS: A CONTEMPORARY PROFILE
All information is from the 2000 Census unless noted otherwise.
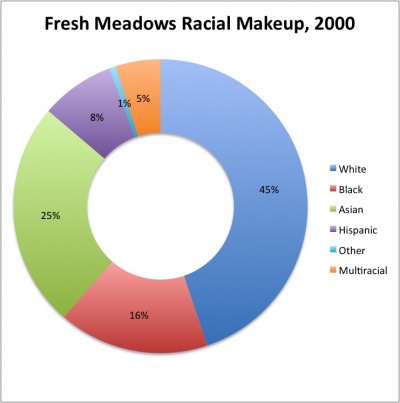
Race/Ethnicity[1]
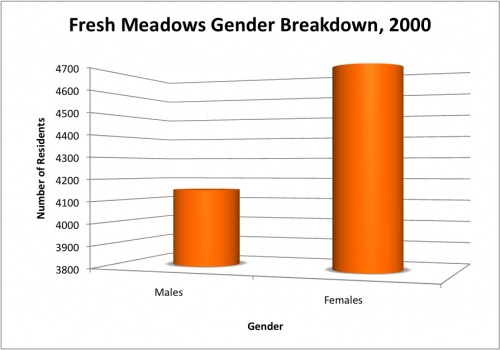
Gender[2]
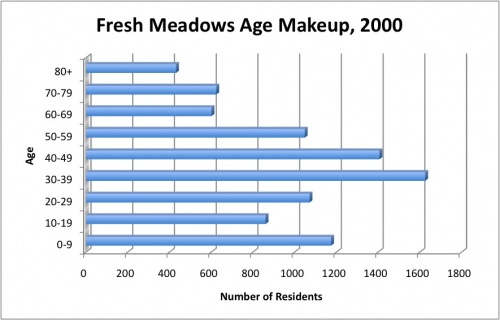
Age[3]
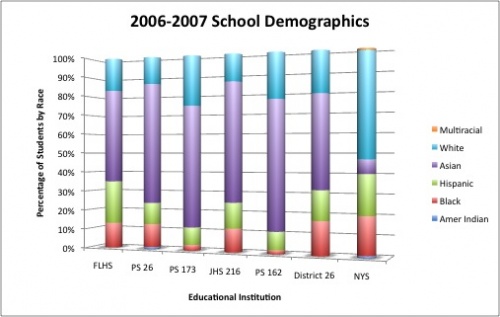
School Statistics 2006-2007[4]
As the first graph indicates, Fresh Meadows school are much more diverse than New York State as a whole. While New York State is has a school enrollment of 52% white, no school in Fresh Meadows is more white than PS 173 at 26%, half of the NYS total. Meanwhile, the least Asian school in Fresh Meadows is Francis Lewis High School, which stands at 48%. This is almost 7x greater than the New York State percentage of Asians at 7%. On the other hand, Fresh Meadows is generally less black and Hispanic than New York State, specially at PS 173 and PS 162.
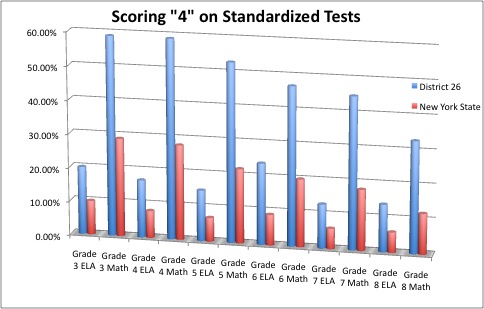
How do these demographics reflect themselves in the performance of schools? Grades 3 through 8 are given statewide Math and English Language Arts examinations. District 26, the school district in which Fresh Meadows is a part of, consistently outperformed New York State as a whole in these 2006-2007 statistics. In fact, in each examination at each grade level, District 26 received no less than 2x of the percentage of students achieving a "4" (the highest possible grade) than the New York State average. Differences were most exaggerated in Grade 8 Math, in which District 26 performed 2.75x better than NYS. On the whole, District 26 performed approximately 2.3x better than New York State.
Foreign-Born Population Year of Entry[5]
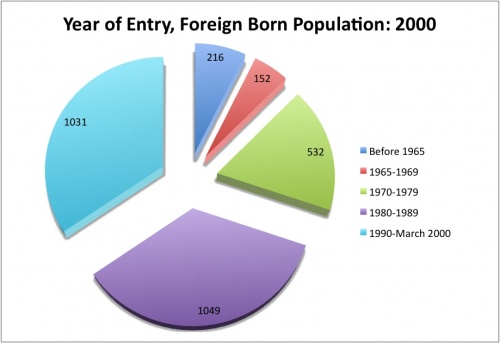
Reflecting the recent population changes in Fresh Meadows, most of the foreign-born population has entered the United States since 1980. The statistic begins dividing time periods in detail after 1965, when the Hart-Cellar Act passed, eliminating national origins quotas put in place in the 1920's. Instead, a preference system was developed to guide immigrant entry.[6] Since then, immigration to Fresh Meadows has drastically increased, beginning to occur on a large scale in the 1970's and peaking in the 1980's. In the 1990's, the number of foreign born immigrants entering Fresh Meadows was a mere 18 less than in the 1980's.
Language Spoken[7]
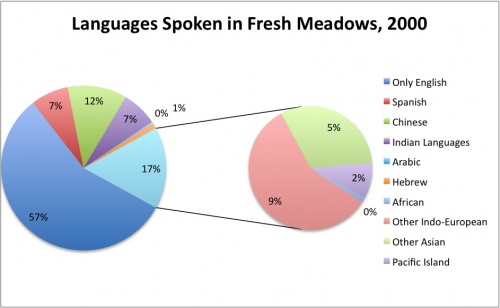
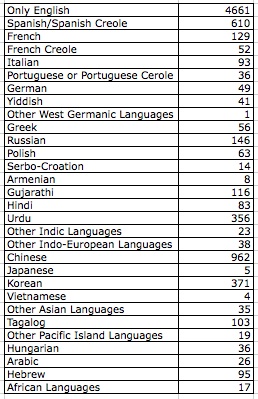
Over 30 different languages are spoken in Fresh Meadows. Although over half of residents speak only English; Spanish, Chinese, Indian Languages, as well as various other European languages such as French, Italian, and Russian are prominently spoken in the area. Some of the less prominent yet equally notable languages spoken include Serbo-Croatian, Vietnamese, Tagalog, Hungarian, Arabic, and Yiddish. It is also important to note than many languages are originally grouped as other in the chart, being so distinct that they were not listed as language choices.
Owner/Renter[8]
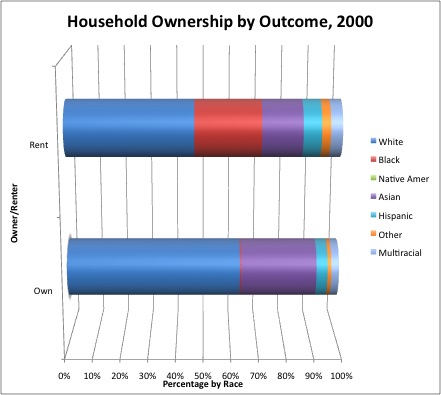
It is interesting to note that whites and Asians are the only groups who make up a larger percentage of those owning rather than renting their places of residence. This trend follows the belief that Asians are less likely to face structural discrimination in residential choices. To the contrary, black make up practically .5% of those owning their residences, yet make up approximately 25% of those renting. Hispanics have made up slightly higher percentages of those renting rather than owning, as do Multiracials and those of "Other" races.
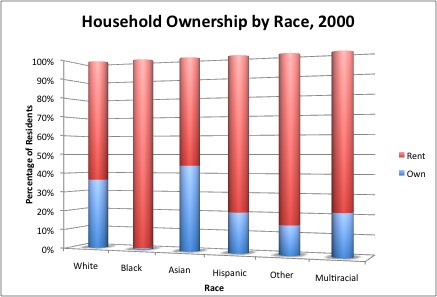
When analyzing data the other way, the results paint an even more skewed housing distribution. While 34% of whites in Fresh Meadows own, 64% rent. Among blacks, .75% own, compared white an overwhelming 99.25% renting. 44% of Asians own their residences, compared with 56% renting. Within Hispanic groups, 21% own with 79% renting. Other races are 15% owning to 85% renting, and Multiracials are 21% owning to 79% renting. These statistics are troubling, to say the least. There must be barriers in place causing such high levels of dissimilarity between racial groups in housing ownership. Because of the high number of available rental units compared to owning units, all groups have favorable percentages toward renting. Asians are the most likely to own, followed by whites, yet all of the other racial groups have extremely large tendencies to rent their residences. There must certainly be more factors at work than simply "residential preference."
Median Household Income[9]
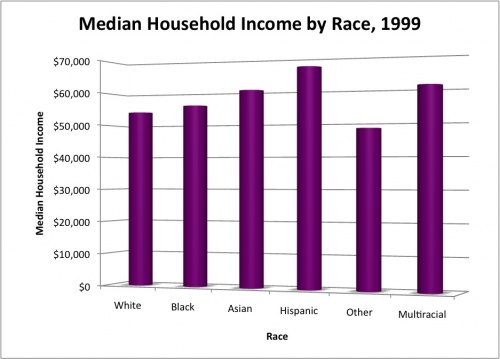
The Median Household Income actually provides a surprising result. Besides "Other" ($48,417), whites actually had the lowest median household income of any group, $54,011. Hispanics led the way at $67,044, followed by Multiethnics at $60,946, Asians at $60,311, and blacks at $55,880. When looked at in the bigger picture, these numbers are actually troubling. Whites make up the largest percentage of household owners, yet have the lowest median income. Besides Asians, the other groups have a large disparity tending toward renting, yet they seem to be able to afford to own. This further confirms the notion that structural barriers seem to be at work.
Educational Attainment[10]
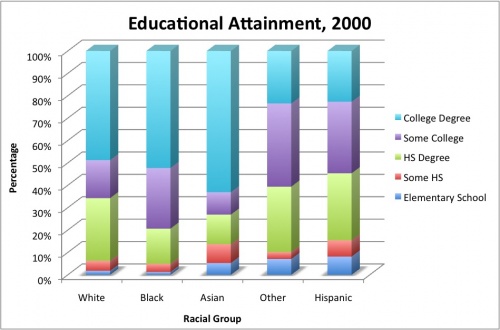
As would be expected due to the notion of the "model minority," an overwhelming majority of Asians have received some form of a college degree, a much higher percentage than that of any other group. Asians had the lowest dropout rate in college, yet were also the largest group to receive only some high school education. Hispanics are the least likely to attend college to any extent, whether dropping out or receiving a degree. Blacks were surprisingly the most likely group to attend some form of college and were second to Asians in terms of achieving a college degree. This seemingly shows that blacks in Fresh Meadows have not developed an adversarial stance causing them to devalue education. Whites are in the middle of the road, being third most likely to attend college to any extent.
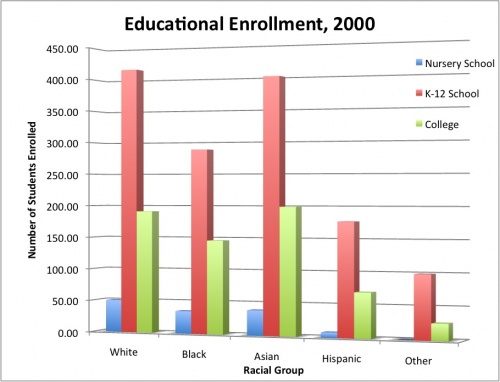
Educational Enrollment[11]
In terms of educational enrollment of Fresh Meadows residents in 2000, whites and Asians are essentially the same. Both have around 400 children enrolled in college, 190 enrolled in K-12, and between 40 and 50 enrolled in nursery school. Blacks are the third most common group in each level of education, with approximately 150 students enrolled in college, 290 in K-12, and 35 in nursery school. Hispanics make up less of the population and are therefore less represented in each level of education, as are those of "Other" races. This statistic reflects the great diversity that can be found in schools in the area, yet also accounts for students enrolled in schools outside of Fresh Meadows.
References
- ↑ Infoshare Online. 1 Apr. 2009 <http://infoshare.org>.
- ↑ Infoshare Online. 1 Apr. 2009 <http://infoshare.org>.
- ↑ Infoshare Online. 1 Apr. 2009 <http://infoshare.org>.
- ↑ nySTART - New York State Testing and Accountability Reporting Tool. 10 Apr. 2009 <http://www.nystart.gov>.
- ↑ Infoshare Online. 1 Apr. 2009 <http://infoshare.org>.
- ↑ "Historical Documents and Speeches - The Immigration and Naturalization Act of 1965." United States History Documents and Speeches - Declaration of Independence, Constitution, Bill of Rights, The Federalist Papers, Magna Carta, Laws and Regulations. 24 Apr. 2009 <http://www.historicaldocuments.com/ImmigrationActof1965.htm>.
- ↑ Infoshare Online. 1 Apr. 2009 <http://infoshare.org>.
- ↑ Infoshare Online. 1 Apr. 2009 <http://infoshare.org>.
- ↑ Infoshare Online. 1 Apr. 2009 <http://infoshare.org>.
- ↑ Infoshare Online. 1 Apr. 2009 <http://infoshare.org>.
- ↑ Infoshare Online. 1 Apr. 2009 <http://infoshare.org>.
