Neighborhood Profiles
Upper East Side
By: George Basaly and Christina Moawad

New York City has been known to be headquarters to most of the financial, advertising, fashion, and corporate law world, where many people prosper well above the average citizen. Top lawyers, CEOs, renowned journalists—they all want to live in style. The Upper East Side is a neighborhood in Manhattan, New York, between the east side of Central Park to the East River, and extends from 59th street to 96th street, where it lodges these successful New Yorkers. Economically, it is one of the most affluent areas in all of New York City, with the mean household income at $242,596. However, according to the US Census Bureau, the median household income is only $153,912. So what makes the skew so large? That is a result of the two public housing projects located just under the northern border, which brings down the median income. In fact, there has been a recent spat over the demolition of a public housing project in the Upper East Side that has been providing affordable housing for nearly a century. It will be interesting to take note of the demographics if this demolition ever goes through. With the few public housing projects in the Upper East Side, we can infer that it accounts for the 5.5% of the population receiving Food Stamp/SNAP benefits. With this public housing project gone, would this ultimately make the corporate sharks of the city happier that their neighborhood is back to being 100% affluent?
In the prosperous community of the Upper East Side, it is interesting to note that 24.1% of the people living there are under the professional category “educational services, and health care and social assistance,” while the second most prominent category being “professional, scientific, and management, and administrative and waste management services,” with 21.8% of the people in that category. Meanwhile, the other majority works in finance and insurance, leaving the other 35% of the people split between other services and trades.
With the wonderful public transportation system the MTA has established, it is not surprising to see that roughly 63% of the people use public transportation to commute to work, even despite their success and ability to afford their own means of transportation. Another 13% of the people stay healthy and walk to work, while a tiny 6.7% of the people drive to work.
The Upper East Side holds the top pricing per square foot in the United States, and this holds no surprise for any New Yorker. It is home to some of the wealthiest Americans, luxury shopping areas, picturesque residential buildings, eminent restaurants and a handful of extraordinary museums. It seems like a perfect world to any outsiders! The data supports the notion of the “prosperous world” the Upper East Side baits, as it is an area many attribute to success.
The demographic profile of the Upper East Side speaks volumes, as the data is certainly exclusive to the area. The zone consists of a substantial white population of 85.3% and the second “largest” race being Asian, comprising of 8.1% of the population. The total population estimate is 215,580 people. If not familiar to city life, this demographic may also bring shock, but if a local, once again, it shouldn’t surprise! Although the exact number may not have been guessed, any New Yorker stopped on the street would have easily speculated and mirrored these numbers.

Upper East Side Profile
Though the race of people living in this area definitely has a clear majority, the discretion of coming from one race verse two or more races, has an even bigger lead. The data shows that 98.3% of the people come from one racial profile in juxtaposition to the 1.7% coming from two or more racial backgrounds. Although this statistic can leave many uncertain as to why is it meaningful data or not, all can agree that trend carries value because of it’s powerful majority.
Another portion of data worth mention is the number of residents between the ages of 25 to 34, making up 21.6% of the population. We can infer that roughly one out of every five residents in the Upper East Side is a young adult. This can also imply a bit about the social aspect of Manhattan, as modern depictions of New York City entail this young adult “New York lifestyle.” (It’s that dazzling, high-class, over-the-top life seen in the movies, that no one actually has!) The data does support that the bulk of population comes from the adult class.
Going back to the notion of success, many wonder where the residents of the Upper East Side are originally from. As a reassuring statistic to the rest of us dreaming of this area, a great 77.2% are born in the United States. An abundant number of 48.7% of these Americans hold New York as their birthplace. Many would agree that this is unquestionably not a town with a history of first time settlement from immigration.
The educational attainment statistics of this area are also another category hard to skim over. A whopping 40.1% of the population 25 years and over, has a Graduate or professional degree. This figure is massive in comparison to other areas of New York that are just miles away. This statistic clearly cements the reason why these people can afford the high quality of living they do attain. Part of the reason that makes New York so great is areas like the Upper East Side, in which all can agree to be a place of esteem.
Belmont (Piccola Italia!)
About
The Bronx neighborhood of Belmont is often colloquially known as “Little Italy” due to the Italian commercial center that is Arthur Avenue located in its heart. Many congregate here to buy fresh produce, meats, and dry goods from locally famous stores such as theTeitel Brother’s and Calabria Pork. There are also many Trattorias, pasticcerias, and bistros along the avenue, a good number of which are still owned by the same Italian families that started them generations ago. Despite all this, however, there don’t seem to be many Italians in Little Italy anymore. As the New York Timeswill attest “Outside Arthur Avenue and its sister commercial strip, East 187th Street, the neighborhood’s Italian standbys become sparse.” Italians seemed to have moved outward into the suburbs; a steady influx of Hispanic immigrants and Albanians has been slowly taking their place since the 90’s.
The Albanian population (section 5.7) in the Bronx is concentrated within only a few locales. The two concentrate Albanian ethnic enclaves in the Bronx are in Belmont and Morris park. Data only speaks to the growth of the Albanian presence in the Bronx. Numbered at 7,500 in 2000, the population of Albanians in the Bronx has jumped 35% since then to 9,500 in 2010. Once facing ethnic discrimination in their home countries, diasporic Albanians have found prosperity in the Bronx. They are local business owners who have occupied the void the emigrating Italian-Americans have left. Ironically, this involves the Albanians fulfilling the Italian role directly; George Dedvukig is the Albanian owner of Giovannni’s (famous) Italian Restaurant on Arthur Avenue and the Madonia Brother’s Bakery bakes some of the city’s best array of fresh Italian breads and is also run by Albanians. This new influx of immigrants, however, is not simply a reiteration of old Italian flavors. The Albanians that immigrate to the Bronx bring with them their tastes like Bulgarian cheeses, Macedonian banana peppers and of course Albanian sujuk.
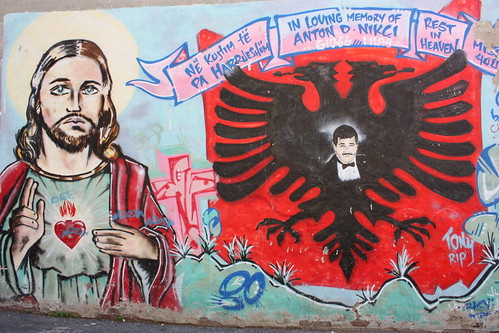 Albanian graffiti in Arthur’s Avenue
Diversity

Quick look at the change in the population of this neighbourhood.
Looking at the demographics as a whole, we see that not much has changed over the past 10 years in Belmont. There has been a slight increase in population, but the diversity of the people who live there remain around the same level. In each of the races, we see either a slight increase in their population, or a slight decrease. When looking under “White” in the one race category for instance, we see that the population has dropped from about 24,347 to 23,623, which isn’t a significant difference. For Black and African American and Hispanic or Latino, we’ve seen an increase 18,077 to 20,629 and 45,783 to 50,680, respectively.
Although the neighborhood is called “Little Italy” (or “Little Albania” by some) the population is predominantly Hispanic or Latino (63.80%), which may be surprising to those who don’t know the Bronx is predominantly Hispanic or Latino, as mentioned above. Compared to this large population, the next two highest populations belong to those who identified as White (29.7%) and Black or African American (26.0%). The Asian and Native Hawaiian and Other Pacific Islanders populations remain relatively miniscule in comparison.
Riverdale
By Christopher and Christian
Located deep in the forests of the Misty Mountains lays a community of ageless elves led by… oh wait, that’s Rivendell. The northernmost neighborhood in the five boroughs, just under Yonkers and somewhat close to Mount Vernon, lies Riverdale, a neighborhood within the Bronx. Instead of lush forests and rushing rivers, there’s asphalt, concrete, and the occasional park. When one thinks of the Bronx, one tends to think of crime and Jennifer Lopez. Riverdale, though not without its share of crime, is often looked at as a pleasant area to live and raise a family. The location is advantageous, the education available is considered to be in the higher part of the spectrum, and it’s generally quiet in comparison to the neighborhoods around it.
Racial Demographics
As for the racial demographic of the inhabitants, the bulk of the population is made up of white people and hispanic people as you can see from the chart below (using data fromthis site). Of the estimated 104,854 people, 63.6% were born in the United States and the remaining 30.9% were born outside of the United States. Overall, Riverdale is somewhat diverse.

Economic Data
Riverdale is a relatively well to do area economically. With a median family income of approximately $76,600 a year, Riverdale is a primarily affluent, residential neighborhood. Speaking of families, about 58.2% of the 40,921 estimated households residing in Riverdale belong to families. Of its population over age 16, about 63.3% of the population is employed, with the majority of professions (34.6%) falling under the categories of educational services, health care, and social assistance with about three quarters of the population being employed by the private sector. http://factfinder2.census.gov/faces/tableservices/jsf/pages/productview.xhtml?src=bkmk
Transportation
Being on the threshold of urban and suburban life, slightly more than half of the population uses public transportation to commute to work while about a quarter travel via car. Riverdale is home to the northernmost stop on the 1 train, 242nd Street Van Cortlandt Park, making it easily accessible from New York City. In addition, there are several different bus lines, some of which travel into the city and some that go to Westchester. Also, being far less congested than the rest of New York City, transportation via automobile is also a viable option.
Housing
With regard to housing, Riverdale offers a wide array of housing options ranging from apartment buildings to million dollar mansions. Most of the housing structures in Riverdale are relatively old. 36.6% of the buildings were constructed prior to 1940; however, the majority of current residents have moved in within the last decade. The value of homes in Riverdale is among the highest in the Bronx with approximately one quarter of homes ranging from $300K-$500K in price and another 23.5% of homes ranging from $500K to $1M in price. According to this New York Times article, when the market fell the prices of homes were reduced in an attempt to sell them. According to the article, the listings increased by 80 percent over 2 years before December 5, 2011.
Places to Visit
Two notable parks in Riverdale include Van Cortlandt Park and Wave Hill. Van Cortlandt Park, a 1146 acre park extending from 240th Street to 263rd street is home to several attractions including a golf course, a nature trail, and several playing fields. It is commonplace for cross country teams to have their meets there as its landscape consists of trails and hills. Wave Hill, once the residence of Mark Twain, is a 28 acre botanical garden overlooking the Hudson River, which is also home to two preserved historical mansions. Visual Art exhibits are also displayed in the Glyndor Gallery as well as outside on the grounds.
Jamaica!
Sunny Aggarwal
Sursehaj Singh

South Jamaica

Graffiti in Jamaica
From the wall-to-wall Graffiti, to the on going construction, Jamaica has taken a step in making the neighborhood’s living conditions more appeasable and attractive. Today, Jamaica is still building to improve its transportation, businesses, and housing tenements. The location of Jamaica makes it one of the most unique communities in Queens. It lies in the center portion of the borough. The south borders include: South Jamaica and St. Albans and on the North borders, there are Briarwood, Jamaica Hills and Jamaica estates. On the east, Hollis borders it and Richmond Hill, South Ozone Park borders it to the West. However, in 1656, the English under Dutch rule in New Netherlands settled Jamaica as a town. Jamaica became a neighborhood in Queens County on November 1, 1683 and was named for the queen consort, Catherine of Braganza, wife of Charles II. Currently, its vast population makes Jamaica hold the county seat with not only the people but also with the diversity of languages spoken (in descending order of priority): English, Spanish, Chinese, Korean, Italian, Greek, Russian, Tagalog, French, and French Creole according to the U.S census (source). Jamaica’s economy is another important factor that also has one of the largest airports in the world John F. Kennedy Airport.
Jamaica is a community in Queens with a diverse population that includes mostly African Americans. There are still a considerable amount of Hispanics, Asians, and white populations. Jamaica wasn’t as diverse as it was today. Throughout the 1950s, Jamaica was heavily populated with whites such as Irish immigrants. Only after that time period, we see the shift toward an African- American population. Based on the table below, it is clearly evident that the African-American population increased until the year 2000, but has decreased since then.
| Year |
1990 |
2000 |
2010 |
|
| Ethnicity (broken down by Census) | Statistic/% | Statistic/% (2) | Statistic/% (3) | Change ’00-’10 (#/%) |
| White Nonhispanic | 8,798/4.4 | 4,837/2.2 | 3,813/1.7 | (1,024)/-21.2 |
| African American Nonhispanic | 155,040/77.0 | 161,530/72.2 | 147,550/65.3 | (13,980)/-8.7 |
| Asian or Pacific Islander Nonhispanic | 8,277/4.1 | 11,009/4.9 | 20,323/9.0 | 9,314/84.6 |
| American Indian Nonhispanic | 1,329/0.7 | 1,059/0.5 | 1,390/0.6 | 331/31.3 |
| Some other Race Nonhispanic | 727/0.4 | 4,273/1.9 | 6,136/2.7 | 1,863/43.6 |
| Nonhispanic of two or more races | 0/0 | 10,166/4.5 | 7,581/3.4 | (2,585)/-25.4 |
| Hispanic Origin | 27,122/13.5 | 27,122/13.6 | 39,126/17.3 | 8,398/27.3 |
| Total Population | 201,293/100.00 | 223,602/100.0 | 225,919/100.0 | 2,317/1.0 |
| Total Housing Units | 64,554/0.0 | 75,111/0.0 | 76,426/0.0 | 1,3515/1.8 |
The neighborhood population estimate is 230,000 people. Hillside Avenue reflects this trend. Along 150th to 161st streets, much of the stores and restaurants are of South American and Caribbean culture. Farther east is the rapidly growing East Indian community. Mainly spurred on by Jamaica Muslim Center, Bangladeshis have moved into this area due to easy transit access and the plethora of Bangladeshi stores and restaurants lining 167th and 168th streets. Neighborhood analysts have concluded that Bangladeshis are becoming the most rapidly growing group in the area and others such as: Merrick Blvd and Sutphin Blvd in South Jamaica. When you are heading down in this same direction, numerous you will find many churches, stores, salons, and hair-braiding shops are thriving in the hip-hop and African-American cultures. However, seemingly growing prosperous, in the 1980s, there was economic hardship, which lead to: increased crime, inadequate infrastructure, and poor businesses. Compared to today, the NYC department of city planning drafted a plan that would reorder blocks of Jamaican order stimulating new development. This revitalization of Jamaica is credited to the Greater Allen Development Corporation (GADC), which was created in December 2007 build communities, and change lives. (source) Jamaica was not always the safest place to live and the GADC implemented ways to decrease crime throughout the neighborhood. Crime rates are high in area’s where there is a lack of jobs and faculties that provide support for the people. Without jobs, people look to support themselves through selling drugs, gang violence, and burglary. The GADC helped create residential and commercial facilities in order to make Jamaica a safe place. The GADC added 630 units of senior housing, more than 150 units of affordable housing, private affordable homes, veteran rental housing, and housing for previously homeless citizens.
The rising of this area of Jamaica can be conveyed through the information in profile/census reports. The rise in the household income of the families is evident throughout the area’s income distribution, shown below (source). Many developing businesses have opened as the increase in immigration of people throughout the years. The population change, based on the profile (source), conveys that from 1990 to 2000 an 11.1% change occurred (201,293 to 223,602 people).

Graph
Also, another sign of the “industrialization” of this area is its ethnic race e breakdown of each decade (i.e. 1990 to 2000 and 2000 to 2010). In the 1990 to 2000 year period, the ore-dominant African-American population decreased approximately 5% and in the next ten-year time, it decreased of another 7%. Therefore, this progressive decline in black population shows a further widespread of race entering the area, which, in effect, gives it a higher value. One another important signal of the rise of District 12 is the denser spread of the housing units (such as the spread of parks, garden lands, more variety on the types of housing, and etc.) Currently, this spread is due to this great and significant increase in the average household income as the community continues to build and shows future potential. The future of Jamaica is perceived to be prosperous one. Commercially, Jamaica has helped its economy and increased the circulation of money as more and more jobs are opening up.
Forest Hills

Jason Samstein
Dashiell Lumas
Forest Hills
Forest Hills is a unique neighborhood, both for it’s cultural diversity and it’s uniquely educated populous. While New York is often known as a “melting pot” of cultures, this has often indicated large blocks of segregated ethnicities, rather then an integrated whole. Forest Hills, however, could possibly be an indication of a changing of trends. Located in the borough of Queens, New York, Forest Hills is home to approximately 69,266 residents, 31,485 males and 37,781 females. In addition, my bike got stolen here. Dashiell Lumas’ bike got stolen out of his driveway in broad daylight in Forest Hills. That just goes to show that even an affluent neighborhood is not without its fair share of crime, and statistics are not necessarily accurate predictors of crime.
Crime
In fact, the crime statistics do tell a bit of a different story. Forest Hills crime rates are so notoriously low that it is often referred to as “the snooze precinct.” As we’ll see this is in line with the perceived utopia of living in Forest Hills. However, tales like those of Mr. Lumas may be indicative of the influence of crime in surrounding neighborhoods. For instance, precinct 103 has seen almost double the crime in 2012, and has witnessed a late increase in crime over the last two years. This means that although crime increase in Forest Hills is non-existent, just the fact that Forest Hills is surrounded by crime-ridden neighborhoods could have an impact on its populace.
Diverse
Forest Hills is a relatively diverse neighborhood. 59.58% of the people in Forest Hills identify themselves as White, 23.70% Asian, 12.03% Hispanic, and 3.73% Black. Surprisingly, about 47 per cent of Forest Hills residents are foreign-born. In comparison, the New York City average for Whites is 43.9 %, 12.8 % Asian, 28.8%, and Black: 24.9%. As is evident by the demographics, there are more White people in Forest hills than in the rest of the city, on average. However, this trend is beginning to change. In particular, the Asian demographic in Forest Hills has increased by roughly 26% from the year 2010 to 2012. The white demographics have seen correlated decline. What this may mean is that a steady increase in immigration has shaken up, the usual block structure of these neighbors. New York has always been known for constant change and this may be another new development with numerous implications.
Forest Hills also has a unique historic element. It is perhaps most remember as the home to the US Open Tennis Tournament. A hired architect constructed many of the homes as part of a planned garden city in 1939, making most buildings relatively old. In addition, Forest Hills was home to such famous characters as Peter Parker in Spiderman. Forest Hills is the real life hometown to famous artists The Ramones as well as Simon & Garfunkel and Ray Romano. The main subway stations are the 71st ave Subway station (E,F,R,M) and the Kew-Gardens Union Turnpike station (E,F). The principal streets and thoroughfares in Forest Hills are Austin St (Shopping), Metropolitan Avenue (Vintage Shops) and Queens Boulevard (Multi-lane highway). Queens Boulevard is also home to Queens Center Mall, the primary shopping center for most Forest Hills residents (and a common hang-out spot for teenagers). Some major schools in the area include Forest Hills High School, Russell Sage Middle School and P.S. 101 elementary school in the gardens. The main outdoor recreational sites are Forest Park and Flushing-Meadows Corona Park.
Economics
Forest Hills is perhaps most prominently known for its wealth. A vast majority of the town is home to citizens in an upper-middle class income range. The town, founded in the 1910’s, was originally intended to be for low-end income families. This plan backfired, however because the price of the housing actually skyrocketed. In fact, in the end this area became one of the higher end areas in all of New York, the Forest Hills Gardens. The neighborhoods poorest area is the northwest edge of Forest Hills, where low incoming housing project lies.
The median household income for Forest Hills residents is $71,805. The median household income for New York city is an estimated $78,403. The mean household income for Forest Hills is roughly $93,000. This reflects Forest Hills relative affluency compared to the rest of New York. The mean household income for residents in New York $78,400. The disparity between mean household income and median household income is always a good indicator of the gap between the rich and the poor. As evident by the statistics from Forest Hills in relation to New York city, we can conclude that the gap in Forest Hills is extremely large (a difference of about $20,000). Interestingly enough, however, for New York City as a whole, the gap is even higher, $30,000. Yet, the $93,527 mean household income of Forest Hills nevertheless suggests that the community is highly affluent. Once again, we see that the expected income is higher then that of New York city overall, given the value of the property in Forest Hills.
Forest Hills relative affluence is reflected in others statistics as well. The percentage of people below the poverty line in New York City as whole is 20.9%. However, in Forest Hills that number is at a relatively low 7%. This is reflected even further when looking at the number of families are below the poverty line. In New York 18% of families are below the poverty line; compared to only 5.4% within Forest Hills.
Some Social Dynamics
Reflecting on Forest Hills’s social statistics also reveals some interesting dynamics. While the average household size in New York is 2.67 and the average family size is 3.47, Forest Hills actually remains behind those average: 2.1 and 2.9 respectively. This brings to light some interesting questions about the dynamics and relationship between wealth and family size. One might have thought the apparent affluence of Forest Hills would have led to a higher average family size, but it seems to have worked in the opposite direction.
However, marital status statistic further complicates the picture. The New York City average of people never married is 46%. In forest Hills, that number is as low 31.5%, which is a very interesting dynamic.
Forest Hills educational level is one of its more staggering characteristics. While in the United States only 28.2% of residents achieve a Bachelor’s degree. This statistic is significantly higher in Forest Hills at 53.8%. In fact, some studies indicate that this level of education is higher then over 98% of neighborhoods in the country. Overall, what can be said of Forest Hills is that the quality of life (education and income of residents) is significantly higher than that of New York City by comparison, which means that Forest Hills may be a more desirable neighborhood to live in than most throughout the city.
Other Interesting Articles
http://www.neighborhoodscout.com/ny/queens/forest-hills/#desc
http://www.urbanresearchmaps.org/plurality/
http://www.nytimes.com/ref/realestate/nabe-forest-hills.html
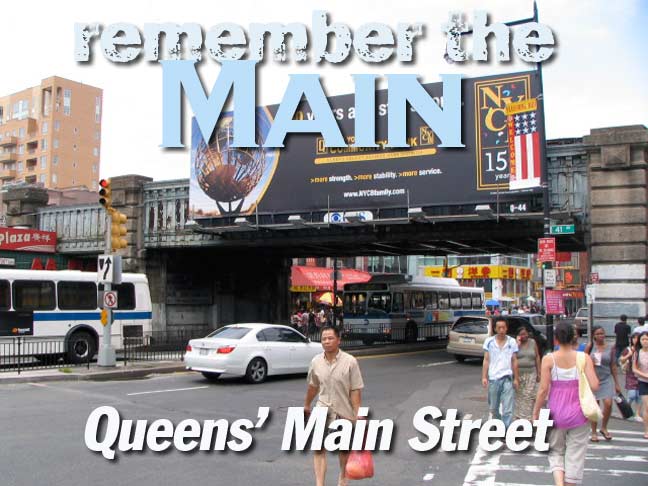
Flushing Queens: Main Street
Flushing, Queens: American Melting Pot on a High Boil
Chidi B. Nnaji and Joyce Chan
Formerly know as the Dutch colony Vlissingen, Flushing has today evolved into one of the major tourist attracting places in Queens, NY.
Main Street, Flushing
To the many residents of and commuters to Queens, the phrase “main street, flushing” calls to mind many main street-unique memories: the smell of charcoal and sultry charred lamb, beef, pork, and chicken kebabs from smoky BBQ carts in front of a Chase bank and images of corners and sidewalks of supermarkets crowded with people gravitating around Hong Kong and Chung Fat Supermarket, to name a few.
The intersection of Main Street and Roosevelt Ave is the third busiest intersection in New York City, after Times Square and Herald Square; so those visiting from outside New York City that find themselves in Flushing en route to Manhattan may mistake it for the heart of the city itself (well, a mini one).
The Food!!!
So just what is it that makes up the hustle and bustle of this unique, cultural center? A long history of immigrant businesses and dreams.
Many people who have visited Flushing will often recall certain restaurants or eateries that they visited: most of these places were started by immigrants, or are immigrant-owned. They are what helped to shape the uniqueness of Main Street and draw visitors from various parts of the globe. Some of the most popular places include Taipan Bakery, Joe Shanghai’s, and the basement packed with regional Chinese cuisines in the fairly new New World mall. Aside from Chinese cuisine, some of the other popular food choices are Korean shabu-shabu, Vietnamese pho, Japanese sushi and sashimi, halal, and Taiwanese bubble milk tea (because some of the first Asian immigrants to Flushing were from Taiwan, it’s no wonder that bubble tea places such as Kung Fu Tea, Chatime, and Quickly’s have been such a huge success).
According to an account by Zhang Pingping (the man who started the Celebrity Travel Service, one of the oldest Asian immigrant-started businesses in Flushing), “[the] elders blamed us for being ‘so bold’ and having the audacity to set up a business in the ‘drug-infested area’… Actually, 40th Road [Flushing] was at the time just a distribution center for marijuana.” It’s really difficult to imagine how the Flushing of thirty years ago compares to the Flushing of today.
Chinatown
If you were to take a poll in Queens and ask the first place to come to mind when one hears the word “Chinatown,” there is a high probability that 90 percent of responses would read, “flushing.” If you haven’t already guessed from the previous paragraphs, Flushing, Queens is considered the Chinatown of Queens. However, unlike the Chinatown of Manhattan, Flushing is a more urban Chinatown with a significant Korean population. Those from Murray Hill (a neighborhood adjacent to the neighborhood of Flushing that has a strong Korean community) would tell you that people travel to Main Street for shopping, food, and education (school or after-school tutoring programs).

So next time you’re looking for a little city excitement without all the crowdedness of Times Square, check out Main Street!
Chinatown

CHINATOWN – A Snapshot
By Katie Cheng & Paul Shapturenko
US Census data does not offer data profiling on Chinatown alone. Instead, the data provided covers an area of three zip codes, collectively dubbed Lower East Side/Chinatown (LESC). Despite this grouping, specific trends can be highlighted regarding this area’s Chinese/Asian population.
Like many neighborhoods around the city, Chinatown is clearly defined by trees and concrete: namely, by Columbus Park and Lafayette Street from the west, and Seward Park and Grand Street from the east.

On weekend mornings, one can make out the usual group of middle-aged Chinese practicing t’ai chi ch’uan, commonly known here as “tai chi”, and picnic benches full of mahjong players. Shopkeepers tend to open early, so shopping connoisseurs and bargain hunters would be wise to come shortly after dawn.
Upon a tourist’s first glance, the area gives an impression of a busy commercial and residential center. The streets are filled with residents and curious tourists alike who are shopping, eating out, or just visiting. It is one of the busier areas of NYC, as there are nearly as many people outside in the nighttime. Walking on Mott Street northward towards Grand, one sees banks, restaurants, specialty shops, bakeries, jewelry stores, street vendors, and signs for medical services and professionals. For many visitors, Chinatown is a cornerstone tourist attraction; as a result, its permanent residents and their lifestyle is obscured by the constant masses of people in the area. A careful examination of readily available Census data shows that this neighborhood and its residents exist as a distinct entity, living side by side with long term residents of the more general Census-covered LESC area.
A profile of Chinatown can be constructed based on the 2009-2011 Census report characteristics. During this period, statistics show that about 25% (Number of foreign-born Asians/Total population) of the LESC total population is born in “Asia” compared to the area’s “Foreign-born” population of 36% (Foreign-born population/Total Population). This indicates that more than half of this area’s foreign-born residents are from Asia.
Chinatown is a changing neighborhood impacted by immigration trends, economic trends, and by the residents who choose to live in this neighborhood. Behind the Chinese stores and restaurants are residents that go to school, work, and live in the neighborhood. As stated previously, those classified as “foreign-born” represent about36% of the total population of this neighborhood. Surprisingly, there is no data which identifies the specific language or dialect spoken by its foreign-born populations, although Asia is extremely diverse in its linguistic roots and evolved modern counterparts. Therefore, we believe that a more complete profile of this neighborhood should include information about specific languages or even dialects spoken at home. This data will more accurately portray Chinatown’s consituent population, and allow for a concise yet specific geographical mapping of its origins.
Although Asian immigration to New York City has been on the rise in the past decade, Chinatown’s population has been on a relatively steep decline. According to Census data, the five-year span between 2006 and 2011 saw the LESC population decline by some 15,710 people, or 9.6%, and specifically a 14% decline in the Asian population. Even if a third of this decline comes from Chinatown itself, it is still in substantial conflict with growing Asian immigration. An explanation for such a phenomenon could be the crowding-out of either residential or commercial sectors, a predominantly non-Chinese Asian influx into the city, or the return of many to their homeland. The latter theory could very well be the most plausible; it appears Chinatown has become increasingly commercialized, sometimes even offering more consumer goods and services than lodging or residential property.
The reasons behind this trend, dubbed the “Chinese Dream” by writer Bonnie Tsui, is similar to the American Dream in its manner of extraordinary upward economic mobility. Now, foreign-born Chinese immigrants to the US are returning to China in increasing numbers. The Chinese government has provided incentives for the move back in the form of financial aid, cash bonuses, tax breaks, and housing assistance. Additionally, labor shortages in China and higher unemployment in the U.S. have contributed to the outflux. To a large extent, Chinatown is suffering from a loss in economic appeal of the entire United States.
Apparently, distraught residents of Chinatown have taken notice of this trend, and have several theories of their own. A Dec. ’08 report by the Coalition Against Anti-Asian Violence (CAAAV) cites gentrification as a major factor in Chinatown’s decreasing number of Chinese residents and local businesses. They state that the development of “trendy” new restaurants and luxury condominiums are to blame for skyrocketing rent and property prices, not to mention other negative spillovers such as neighborhood criminalization. This would undoubtedly repel potential Chinatown inhabitants, many of whom are low-income residents and small-business owners. New businesses cater to a much wealthier clientele, further widening the considerable sociocultural gap in the neighborhood.
Central Harlem
By: Morgan Flynn and Abin Sajan
Through 20s and 30s, Central Harlem was the site of a revolutionary cultural change in the African American community. The “new negro movement”, later known as theHarlem Renaissance is responsible for some artistic legends such as Langston Hughes, Duke Ellington, etc. Before the Harlem Renaissance, middle and upper class white families mainly occupied Harlem. A shift in ethnicities occurred as the Harlem Renaissance captivated national attention. Middle and upper class white families left the area and African-Americans moved in from around the nation.
Even today, this stronghold of African-Americans has survived for over a hundred years. Those who are of African American/Black race make up approximately 68.9% of the entire population in Central Harlem. However, due to an increase in student population and the relative affordability of housing in the area, the white population has started to grow up to 19.3%, which when taking into account how strong the African American presence is in Central Harlem, is a fairly large percentage of the population. This growth of the white population has much to do with the decrease in the crime rate in this area, which has gone down significantly in the past ten years, making the area more appealing to outsiders. Arguably the largest factor in the increase of whites in Central Harlem is the amount of prime, affordable real estate that is manageable to young adults, either studying in college or jump starting their career and looking for a long term stay in an area that is relatively safe and not as hard on their wallets.
| Race alone or in combination with one or more other races | |||
| Total population | 124,233 | +/-4,592 | 124,233 |
| White | 23,960 | +/-2,140 | 19.3% |
| Black or African American | 85,603 | +/-3,773 | 68.9% |
| American Indian and Alaska Native | 1,180 | +/-384 | 0.9% |
| Asian | 4,830 | +/-996 | 3.9% |
| Native Hawaiian and Other Pacific Islander | N | N | N |
| Some other race | 13,929 | +/-2,072 | 11.2% |
When looking at the type of households that occur in Central Harlem, the previous statement of young adults moving to the area for opportunity rings true. Of the total households in the area, 50.7% of them are nonfamily households, and of that percentage only 12.7% are ages sixty five and over, and an overwhelming 43.0% are living alone. Of all the households, an astonishing 60.4% included individuals who have never been married. This makes sense when considering the students that have migrated from expensive housing in the Upper West Side upwards to Central Harlem, where they would not have a family to raise or a significant other because they are still fairly young. However, the percentage of family households is not to go unnoticed. Of the 49.3% of family households living in the area, 24.2% have children under the age of eighteen. From this number it is safe to assume that these are relatively young parents with small children, who are also looking for a cheaper place to live than a more expensive apartment further downtown. Both statistics involving households prove the notion that young adults, whether they are of African American or white race, are migrating towards Central Harlem at a larger rate than before.
| HOUSEHOLDS BY TYPE | |||
| Total households | 51,743 | +/-1,671 | 51,743 |
| With own children under 18 years | 6,900 | +/-770 | 13.3% |
| Nonfamily households | 26,255 | +/-1,512 | 50.7% |
| Householder living alone | 22,244 | +/-1,501 | 43.0% |
| 65 years and over | 6,577 | +/-735 | 12.7% |
| Households with one or more people under 18 years | 14,991 | +/-1,228 | 29.0% |
| Households with one or more people 65 years and over | 10,633 | +/-782 | 20.5% |
Central Harlem has never been an area where incomes were particularly high, as many Americans nowadays are struggling to find a job after the devastating recession. While more than half of the population, 59.8% of the population to be exact, a shocking 40.2% of people living in Central Harlem are not in the labor force. Because of this, it is not hard to believe that 23.7% of the population uses Food Stamps/SNAP benefits in order to pay for household necessities. Overall, 24.2% of all families in Central Harlem are below the poverty level.
| EMPLOYMENT STATUS | |||
| Population 16 years and over | 101,376 | +/-3,444 | 101,376 |
| In labor force | 60,613 | +/-2,979 | 59.8% |
| Civilian labor force | 60,613 | +/-2,979 | 59.8% |
| Employed | 51,811 | +/-2,636 | 51.1% |
| Unemployed | 8,802 | +/-977 | 8.7% |
| Armed Forces | 0 | +/-115 | 0.0% |
| Not in labor force | 40,763 | +/-2,477 | 40.2% |
| Civilian labor force | 60,613 | +/-2,979 | 60,613 |
| Percent Unemployed | (X) | (X) | 14.5% |
| Females 16 years and over | 56,095 | +/-2,225 | 56,095 |
| In labor force | 31,993 | +/-1,781 | 57.0% |
| Civilian labor force | 31,993 | +/-1,781 | 57.0% |
| Employed | 27,601 | +/-1,486 | 49.2% |
Upper West Side
By: Brian Wang
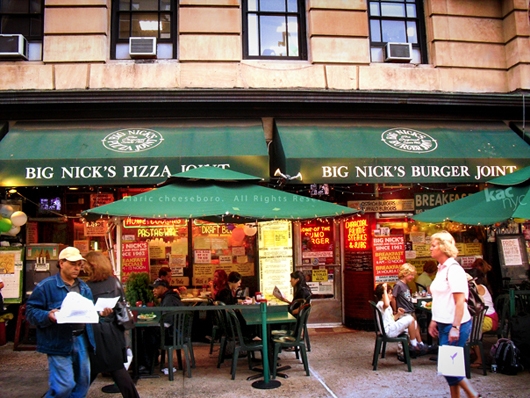 Big Nicks Burger and Pizza Joint
(Source: http://tinyurl.com/a4eebx6)
If you happen to walk by West 79th St and Broadway on any given day at lunchtime, you’ll probably find a large line waiting to get in what appears to be a whole-in-the-wall restaurant. At a closer inspection, you’ll find that the restaurant’s name is “Big Nick’s Burger and Pizza Joint.” Since the 1960s, Big Nick’s has provided a huge array of food from an enormous, 13-page menu to patrons at affordable prices. But that might all change. Big Nick’s may close in the future because of a 50%, or $20,000 per month, rent hike for a 1,000 square foot piece of property. Welcome to the Upper West Side.
Nestled between Columbus Circle and approximately 110th St between Central Park West and 12th Avenue is the quaint, primarily residential neighborhood of The Upper West Side. In fact, nearly 90% of the employed workforce commutes to work with an average commute time of 29.5 minutes. Tourists might stop to look at landmarks such as the American Museum of Natural History, Lincoln Center, or even Macaulay Honors College. Casual New Yorkers might stop by for a break from the hustle-and-bustle of Midtown by strolling past the countless apartments, grabbing a bite at one of the neighborhoods many established restaurants, or shopping at one of the many mom-and-pop stores or chains. But what lies behind the surface of the Upper West Side? What are the people like? What about the real estate? Just by digging lightly into the Upper West Side, you can find many interesting economical details of the neighborhood.
One of the first things you’ll notice about the Upper West Side is the high income and educational levels of the residents. How high? The per capita income, which measures

Upper West Side residential apartments. Photo by Nathaniel Arnold.
income per person, is approximately $82,987, well above the same number for New York City, $31,417. Going further, the median family income is about $153,912, which is nearly three times the New York City median family income. Since the median household income for the Upper West Side is almost $100,000 above the median family income at $242,596, we can assume that the family income distribution heavily favors the upper end of the income spectrum. What makes the per capita income so high? Without more comprehensive studies, it is difficult find causation for the above question. To provide answers, we would have to study the movement of people in and out of the Upper West Side and correlate them with other factors, such as real estate prices, development, etc. For example, it is possible that rich families moved to the Upper West Side because they could afford the high real estate prices or that families obtained positions of high income because they came from a wealthy area.
However, the statistics regarding education can provide evidence of correlation with high income. Of the population 25 and older, 75.6% have a bachelors, or graduate/doctoral degree. According to the Bureau of Labor Statistics, people who hold Bachelors and graduate/doctoral degrees combined make a median of $1,400 per week, nearly 75% more than the median weekly income across the United States.
Another interesting thing you’ll notice is that the Upper West Side is expensive to live in. Those small, one or two bedroom apartments you passed while walking along Columbus Avenue or Central Park West? The average price one of those is $950,000, plus nearly $2,000 a month of fees. (For comparison’s sake, that same $950,000 will get you a spacious house in Great Neck.). Situated next to those multi-million dollar apartment complexes, however, are often rent-stabilized housing projects that may cost under $400 a month to live in. As a result of the many low-cost, government-funded housing options available in the Upper West Side, it isn’t too surprising that approximately 10% of families have an income below $25,000, placing most of them below the poverty level.
For now, enjoy small scale establishments like Big Nick’s Burger and Pizza Joint while you can. As the Upper West Side becomes more commercialized, developed, and expensive to live in, you’ll start to see more and more complexes such as Columbus Square, a set of expensive apartments and retail space (mostly for large chain stores) spring up and take the place of mom-and-pop shops. Walk down any street after school hours and you can already see the effects of commercialization: you’ll see elementary-school aged students waving around the newest smartphones while their parents follow along carrying designer bags and wearing designer clothing.
Greenwich Village
By: Medwin Chiu and Liudi Yang

Amidst the honking traffic, the scurrying of people, and the sauna effect of steam vents, there is a quaint little neighborhood away from all the clatter. With just a turn or two from the red subway line, the surrounds change to what seems like a Queens neighborhood smack in the middle of lower Manhattan. This is Greenwich Village. Next to it, in the Financial District we see a continuation of what one envisions Manhattan to be like. While Greenwich looks more peaceful and quiet, with small historical tenement buildings, the Financial District is busy and loud with towering skyscrapers. These two places make up a majority of lower Manhattan. Greenwich Village has a very rich history of immigration patterns. Serious immigration did not take place here until the late 19th century when it started to give characteristic to the neighborhood as seen here. What was the home of the upper class became overwhelmed with French, Irish, and Italian immigrants, making the area more commercialized. However, as seen here, this new tenement district also attracted artists and bohemians who found the area desirable due to low rent. Fast forward to today, we see an impressive neighborhood that very diverse in culture thanks to its colorful past. Geographically, Greenwich Village is the area between Houston and 14th St, from the Hudson River to Broadway Avenue The Financial District, on the other hand, is the area below Chambers St. from the East River to the Hudson River. However, for purposes of this report, the demographic information is about the people who live below 14th St. from the Hudson River to Bowery, part of both these neighborhoods. Known for one of the symbols of American capitalism, Wall Street, the Financial District houses many other institutions of finance. It gets it’s fair share of tourists, whether it be for the Charging Bull or the famous Tiffany’s and Co. in the area. The demographics of Greenwich Village and the Financial District in the modern day is an interesting view of a part of New York City. We will explore it further throughout this blog post.
What characterizes an average American? Well, it would be someone who lives in the suburbs, a parent, eats an average of 25 pounds of candy a year, go to bed at midnight, and own at least one pet, according to the 2000 census as discussed in an NPR “Talk of the Nation” session. People who live in Greenwich Village and the Financial District are nothing like the typical American based on the American Community Survey (ACS) from the United States Census Bureau. First off, as seen in this table, the economics of the people who live in this area are nothing like what represents an average American. The salary people earn has a median of $108,446. This is more than twice the national average. At $995,100 as the median housing value, you’ll find the explanation for a lot of the demographic trends. 75.7% of the people who live in this area are in the work field. Many of them have occupations in the management, business, science, and art fields. Looking at The Greenwich Village Chelsea Chamber of Commerce website, you can see a reflection of this diverse group of workers. From the Consultant groups to the Blue Note Jazz Club, The Greenwich area has many opportunities for the young workers.
When you think of those sappy love dramas in NYC, the main characters usually live in the Village. This is because the Village is a relatively young section of NYC with about 44% of the population in this area between the ages of 20 and 40. What’s more interesting is that about 57% of the entire population is single. Based on this information, it can be inferred that many young people do move into the Village area to seek out a potential love life. Now, if you were to predict a change within the next 10 years of this area of Manhattan, you would probably not see much of a change. This is because of a low fertility rate among women, as seen in this chart, which says that only about 2000 women give birth every year. This population isn’t going anywhere anytime soon either. The Village will continue to be a hub for the young people of New York.

Despite its youthfulness, Greenwich Village and the Financial District are not too terribly diverse areas of NYC. The population of Greenwich and the Financial District has an overwhelming amount of Caucasians, as seen from this chart. With 76.6% of the area comprised of them, it is clear that they dominate the area. The next largest demographic group would be Asians, which comprise of a fair amount of the population, 14.5%. With the culturally diverse and artistic group of youths we see in the area, diversity in ethnicity of the dwellers is something that is lacking in this area of Manhattan.
By looking at the “Educational Attainment” section of this chart from earlier, the majority of the population here is well educated. “Education is the key to success” they say. We can definitely see a correlation between the level of education and the income levels of these neighborhoods. With almost 80% of the population having a bachelor’s or graduate degree, the population of Greenwich is definitely comprised of individuals who are seeking advancements in their careers early on. We could also see why people of the Financial District would have a strong educational background.
Greenwich Village and the Financial District is one of the most modern and more youthful areas of Manhattan. Looking towards the future, should we expect a change in the population? Seeing the price of living and the overall environment of the area, this trend won’t be changing anytime soon.