Demographic of Belmont
Located in the west Bronx, the neighborhood of Belmont runs from Fordham Road in the north, to Bronx Park in the east, to East 183rd Street in the south, to Third Avenue in the west. The neighborhood’s zip codes of 10457, 10458, and 10460 create a crescent shaped surface area of 0.626 square miles as shown in the map 1.1.
-

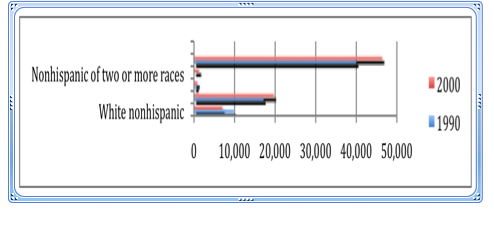
- Demographic changes in Belmont, Bronx from 1990-2000
-

- White Population in Belmont, Bronx 2007

-

- Hispanic Population in Belmont, Bronx 2007

-

- Black Population in Belmont, Bronx 2007

-
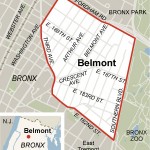
- Belmont, Bronx boundary

In the past ten years, the demographics of Belmont have become more diverse due to the emigration of some major ethnic groups that has allowed the immigration of other ethnic groups. As shown in graph 1(bxneeds_2010.pdf)1, the “white-nonhispanic” that used to make up the demographic in Belmont has declined from 9,815 to 7,021, which is -28.5% of the original population. Recently, the Hispanic and black/African American populations have grown immensely in this neighborhood.2 (Graph 1.)
Joseph Salvo, the Population Director of the City Planning Department of NYC, commented that the number of Irish and Italians was noticeably decreasing in the past years. This fact appeared in the New York Daily News as well3. He explained that the dwindling number of Italians and other Western-Europeans in Belmont has paved the way for other races such as Albanians, Dominicans, African Americans and Guyanese, to fill the resulting vacancy and affect vast diversifying change in the demographics of Belmont.
In 2000 to 2008, the unemployment rate in CD 106 (Belmont and/East Tremont) decreased from 45.5% to 43.0% while the poverty rate has fallen from 21.2% to 12.5%4. With the lower unemployment and poverty rate, the felony crime rate in CD 106 also decreased from 48.6% to 37.6% per 1000 resident. As shown in the data, the overall neighborhood quality in CD106 has improved in terms of both public safety and living conditions. On top of that, the public educational system in CD 106 seemed to show great improvement: the student grade-level performance in math and reading jumped 19.2% to 74.6% and 24.6% to 56.5% respectively.
However, the median household income in CD 106 is only $20,962. 73.3% of the population earns less than $38,000, 3.1% earns $110,000 and above, and the other 23.3% earns between $38,001 to $109,999 per year. Therefore, the majority of the local inhabitants live only slightly above the poverty line.
A lower unemployment/poverty rate and an improved public education system are just two factors that attract new working-class ethnic groups to Belmont. The primary reason for this influx is the “increase of housing units, as a result of rehabilitation of existing buildings.” With the availability of new housing units and old existing housing units from locals who have moved out, people who used to live in crowded city apartments are willing to travel up to the Bronx and search for a more comfortable living environment. As opposed to the intra-city migration pattern, the younger generations of white-nonhispanics are moving out of Belmont and the Bronx and into the suburbs in order to find the best education and living conditions for their children.